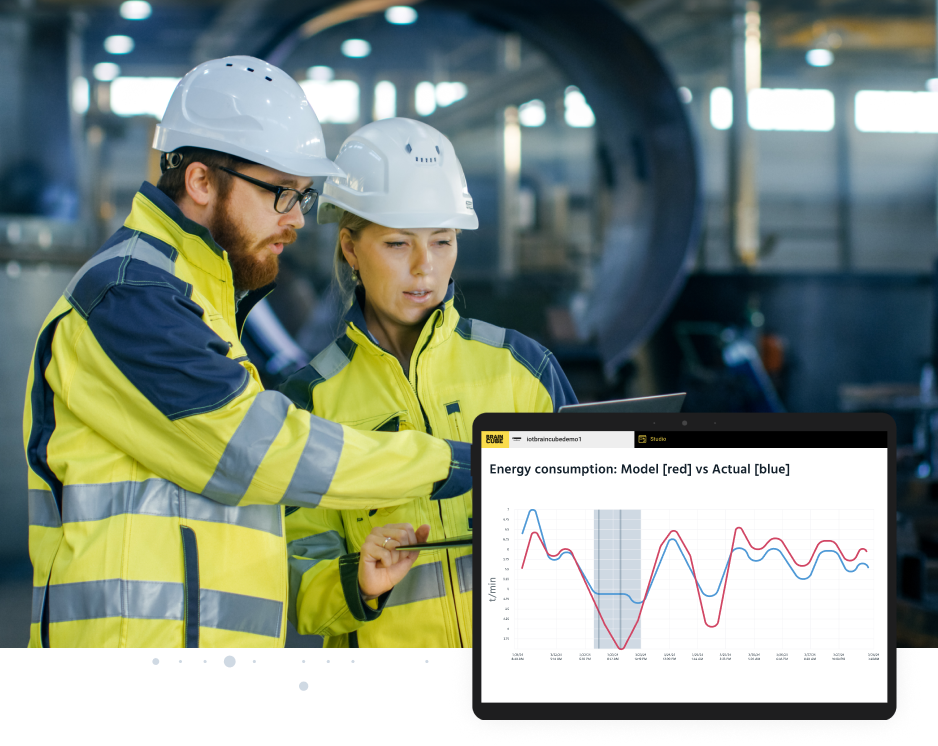

Connect plants, digitalize operations, and gain value from your industrial data
Use self-service descriptive analytics to understand and report on production conditions. Build upon your data visualization toolset with auto-ML/AI, advanced modeling, and more. We’re here to support your industrial 4.0 strategy, whichever steps you choose.
Braincube believes in equipping industrials with ready-to-use applications that make their jobs more productive and convenient. The Data Visualization app package makes it easy for anyone at your organization to get clear visibility into the most important, up-to-date information, whether it is a single machine’s status or a complex company-wide KPI.
Learn more about Braincube’s Apps now available in the Microsoft Azure Marketplace.
Descriptive Analytics Apps for Microsoft Azure
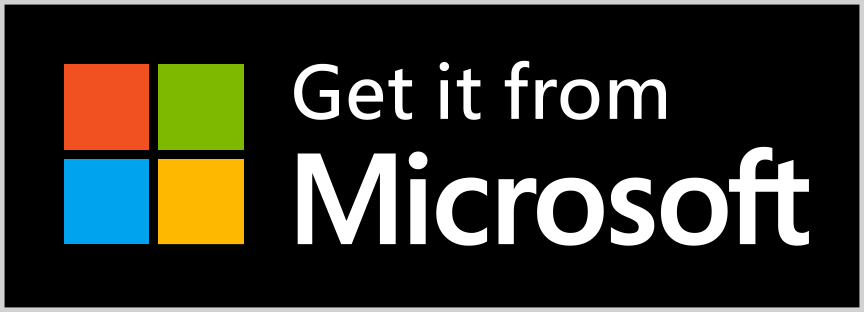
Charts
Quickly display, analyze, and share your data through powerful charts or tables. Build custom charts relevant to your goals using the intuitive interface and share your results with colleagues in just a few clicks.
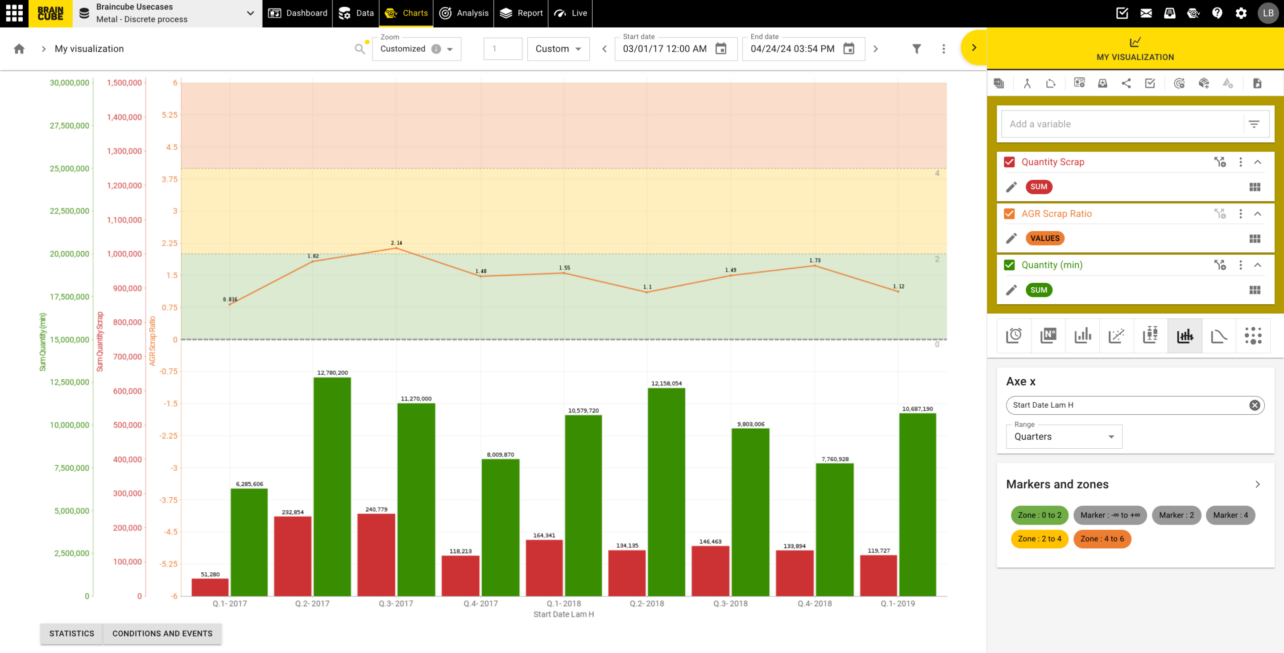
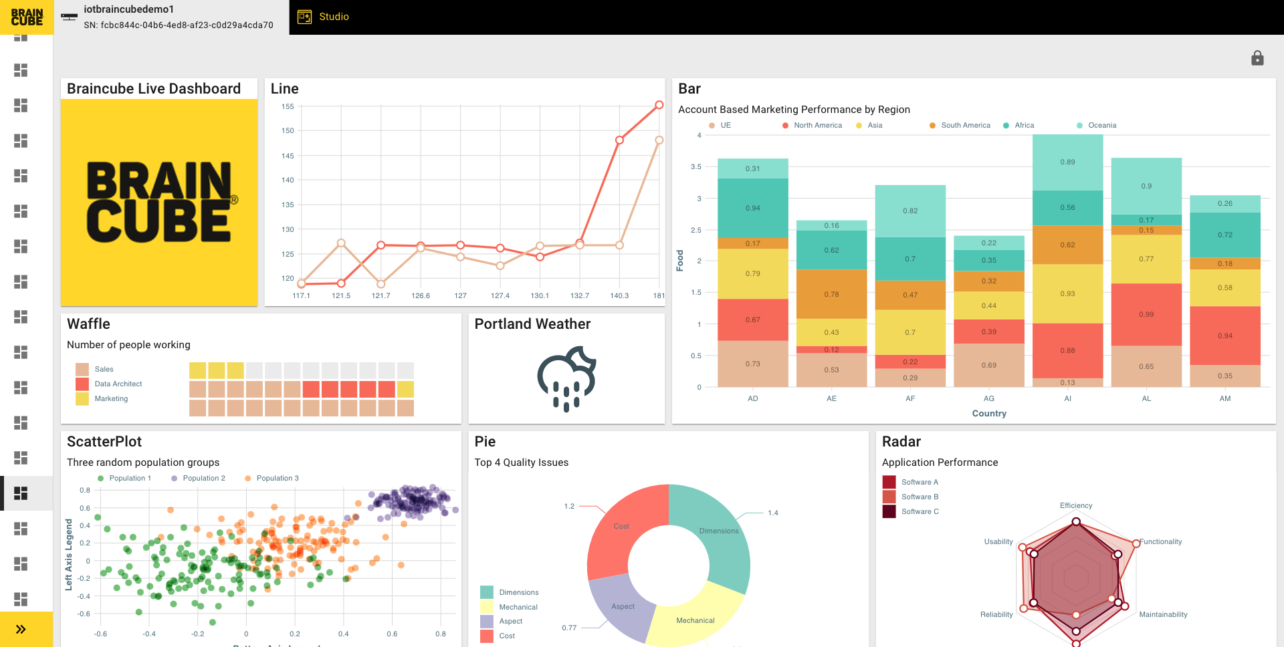
Dashboards
The Dashboard App serves as a centralized hub to monitor your most important, up-to-date production data and KPIs. Create individual private or shared dashboards for quick and easy reference to actionable insights and reports. via visual, no-code dashboards.
Studio
Use the Counter App to monitor the progress of your production teams by counting goods, defective parts, and production rate.
Seamlessly create a dashboard or Pareto chart to visualize productivity, aggregated by references, defects, or production goals.
Take the next step in your Industrial Transformation
Request a Demo
See the apps in action. Request a customized demo to learn how to leverage descriptive analytics on Cloud.
Get Started
Begin using Braincube’s Data Visualization apps in your existing Microsoft environment. Visit the Marketplace to download now.